Examination of Results |


|
Examination of Results |
|
This article summarises some of the more pertinent results for the abandonment analysis. It is divided into the following sections:
‘Summary Report File’ describes the contents of the summary report file.
‘Analysis Report File’ describes the contents of the analysis report file for one of the analysis stages.
Note
For this example the results from PipeLay Starter Edition may differ to those outlined here as only tension criteria can be specified in Starter Edition. This does not affect the availability of outputs.
As described in the 'Viewing the Results', the Summary Report File contains a summary of results across the range of analysis stages. The main section of the summary report file contains a synopsis of parameters which have requested via the Summary Postprocessing tab of the Analysis component. This information is presented in both tabular and graphical format. A summary of installation criteria convergence is also presented.
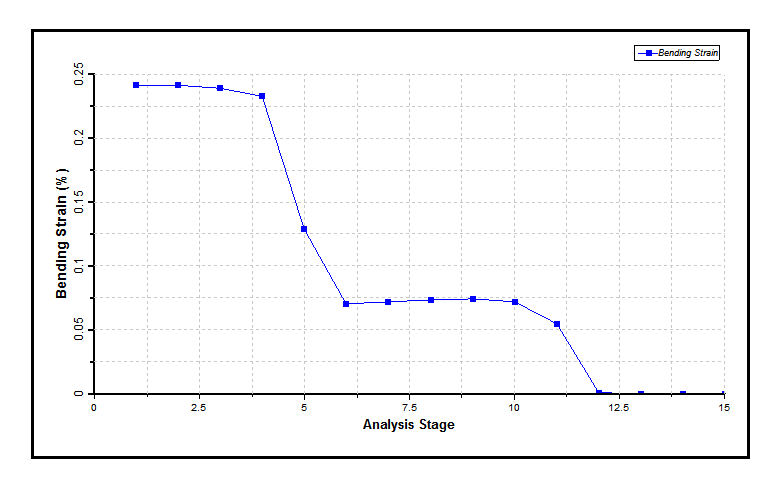
In 'Specifying Installation Criteria', you specified that the maximum allowable bending strain was 0.242%. Visual inspection of the results (i.e. Results Summary table, Installation Criteria Summary table or the bending strain plot) shows that this criterion has been successfully adhered to in all stages of the abandonment process. The figure below plots the maximum bending strain as a function of analysis stage. This plot illustrates how the bending strain reduces significantly as the pullhead passes over the stinger from stage 4 to 6.
Back to Worked Example Overview
The figure below plots the stinger tip separation as a function of analysis stage. The maximum separation, just under 0.9m, occurs in stage 13 after all the pipeline is lowered to the seabed. This is just under the maximum allowable separation limit.

Tip Separation per Stage
Back to Worked Example Overview
The figure below plots the top tension as a function of analysis stage. This plot depicts a general reduction in top tension after the pullhead passes over the stinger from the vessel to the seabed settling at a constant tension in stage 12 when the pullhead fully touches down on the seabed.

Top Tension per Stage
The figure below plots the pullhead elevation as a function of analysis stage. The pullhead gradually descends to the seabed as the pipe is being abandoned.

Pullhead Elevation per Stage
The figure below shows layback as a function of stage number. The layback remains relatively constant when the pullhead passes over the stinger as the Seabed Connection is offset away from the vessel so that the bending strain is below 0.242%. The layback increases once the pullhead clears the stinger and decreases again as the pullhead approaches the seabed.

Layback per Stage
Back to Worked Example Overview
As described in 'Viewing the Results', the Analysis Report File contains all the results generated for a particular analysis stage. The Static Solution Summary section, contains a summary of the fundamental model inputs (for example pipeline geometric and structural properties) and some standard computational outputs (such as pipe tension, touchdown, projected span length etc.). It also contains a summary of output parameters at critical locations in the model – touchdown point, support locations etc., which affords an overview of forces and moments at the most critical locations in the model. The remainder of the document presents specific results in plot form.
Back to Worked Example Overview