Custom Postprocessing Data Inputs |


|
Custom Postprocessing Data Inputs |
|
The Custom Postprocessing component allows output in four categories –Snapshot, Timetrace, Spectrum, and Statistics. The output categories available depend on the type of analysis – static or dynamic – for which customised output is requested. Also, and more importantly, the operation of the input dialogs for the various output categories depends on whether or not a unique Model component is assigned to the Custom Postprocessing component.

Input |
Description |
Model: |
A drop-down list used to associate a Model component with the Custom Postprocessing. The default is <none>. When a Model is specified the Timetrace – Separation button is enabled while the Define – Element Sets button is disabled. Note that after a Model is selected the majority of input dialogs on the Custom Postprocessing component are updated to allow for the selection of model-specific components via suitable drop-down lists rather than having to manually type in element set names etc. The only exceptions to this update feature are the Timetrace – Wave Elevation, Timetrace – Time Step, Spectrum – Define, Spectrum – Elevation and Define – Plot Settings dialogs. |
Analysis Type: |
A drop-down list used to select the type of analysis to be postprocessed. The analysis type may be Static or Dynamic. The Spectrum and Statistics postprocessing facilities are enabled for dynamic analyses only. |
Snapshot – Motion |
Click on this button to display the Snapshot – Motion dialog. This dialog varies depending on whether you select Static or Dynamic from the Analysis Type drop-down list. See the ‘Snapshot – Motion Dialog’ section for a detailed description of the dialog. |
Snapshot – Force |
Click on this button to display the Snapshot – Force dialog. This dialog varies depending on whether you select Static or Dynamic from the Analysis Type drop-down list. See the ‘Snapshot – Force Dialog’ section for a detailed description of the dialog. |
Snapshot – Structure |
Click on this button to display the Snapshot – Structure dialog. This dialog varies depending on whether you select Static or Dynamic from the Analysis Type drop-down list. See the ‘Snapshot – Structure Dialog’ section for a detailed description of the dialog. |
Snapshot – Reaction |
Click on this button to display the Snapshot – Reaction dialog. See the ‘Snapshot – Reaction Dialog’ section for a detailed description of the dialog. |
Snapshot – Separation |
Click on this button to display the Snapshot – Separation dialog. See the ‘Snapshot – Separation Dialog’ section for a detailed description of the dialog. |
Timetrace – Kinematic |
Click on this button to display the Timetrace – Kinematic dialog. See the ‘Timetrace – Kinematic Dialog’ section for a detailed description of the dialog. |
Timetrace – Force |
Click on this button to display the Timetrace – Force dialog. See the ‘Timetrace – Force Dialog’ section for a detailed description of the dialog. |
Timetrace – Reaction |
Click on this button to display the Timetrace – Reaction dialog. See the ‘Timetrace – Reaction Dialog’ section for a detailed description of the dialog. |
Timetrace – Wave Elevation |
Click on this button to display the Timetrace – Wave Elevation dialog. See the ‘Timetrace – Wave Elevation Dialog’ section for a detailed description of the dialog. |
Timetrace – Time Step |
Click on this button to display the Timetrace – Time Step dialog. See the ‘Timetrace – Time Step Dialog’ section for a detailed description of the dialog. |
Timetrace - Separation |
Click on this button to display the Timetrace – Separation dialog. See the ‘Timetrace – Separation Dialog’ section for a detailed description of the dialog. As stated previously this button is only enabled when a Model component has been selected on the Model drop-down list. |
Spectrum – Options |
Click on this button to display the Spectrum – Define dialog. See the ‘Spectrum – Define Dialog’ section for a detailed description of the dialog. |
Spectrum – Motion |
Click on this button to display the Spectrum – Motion dialog. See the ‘Spectrum – Motion Dialog’ section for a detailed description of the dialog. |
Spectrum – Force |
Click on this button to display the Spectrum – Force dialog. See the ‘Spectrum – Force Dialog’ section for a detailed description of the dialog. |
Spectrum – Reaction |
Click on this button to display the Spectrum – Reaction dialog. See the ‘Spectrum – Reaction Dialog’ section for a detailed description of the dialog. |
Spectrum – Elevation |
Click on this button to display the Spectrum – Elevation dialog. See the ‘Spectrum – Elevation Dialog’ section for a detailed description of the dialog. |
Statistics – Motion |
Click on this button to display the Statistics – Motion dialog. See the ‘Statistics – Motion Dialog’ section for a detailed description of the dialog. |
Statistics – Force |
Click on this button to display the Statistics – Force dialog. See the ‘Statistics – Force Dialog’ section for a detailed description of the dialog. |
Statistics – Reaction |
Click on this button to display the Statistics – Reaction dialog. See the ‘Statistics – Reaction Dialog’ section for a detailed description of the dialog. |
Statistics – Separation |
Click on this button to display the Statistics – Separation dialog. See the ‘Statistics – Separation Dialog’ section for a detailed description of the dialog. |
Define – Plot Settings |
Click on this button to display the Plot Data dialog. See the ‘Plot Data Dialog’ section for a detailed description of the dialog. |
Define – Element Sets |
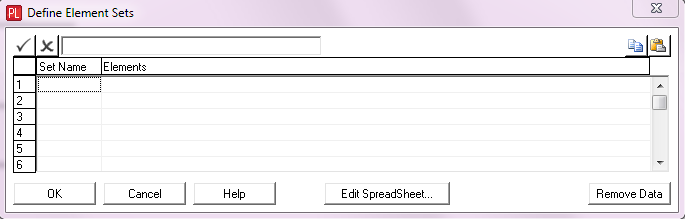
Click on this button to display the Define Element Sets dialog. See the ‘Define Element Sets Dialog’ section for a detailed description of the dialog. As stated previously this button is disabled when a Model component is selected on the Model drop-down list. |

Input |
Description |
DOF: |
The global degree of freedom (DOF) for which the snapshot is required. Specify a value of 1 for the global X direction, 2 for the global Y direction, or 3 for the global Z direction; 4, 5 or 6 for the components of the rotation vector in the global X-, Y- and Z-axes respectively; or 7 for the magnitude of rotation. |
Time: |
The analysis time at which the snapshot is required. This input is only displayed for dynamic analyses. In the case of a dynamic analysis, when you specify a time value for a snapshot, PipeLay searches the analysis database for the analysis time nearest to the value you input. For a snapshot at the analysis finish time, specify a time that is greater than the finish time you specified in the Analysis component. Units: [seconds] |
Title: |
A descriptive title to be output on the plot. This input is optional. |
Scale: |
A scale factor to apply to the data. This input is optional, and defaults to a value of 1. If you change from the default, the value you specify becomes the default for subsequent postprocessing requests, until you explicitly change it again. |
Superpose: |
This input is used to specify if this plot is to be superposed on the previous one, that is, if this plot and the previous one (and possibly others before that and also others after this) are to appear on the same graph. |
Element Set: |
The element set for which the snapshot is to be produced. By default, Snapshot – Motion plots are produced for all elements of the structure (corresponding to the element set “All”). The name of the element set that you specify must correspond either to an element set defined using the Define Element Sets menu (which is brought up by pressing the Element Sets button) or to an element set that is automatically generated by PipeLay. This input column only appears in the case where no Model component is assigned to the Custom Postprocessing. |
Comp Type: |
A drop-down list that allows you to specify the component type for which the snapshot is to be produced. There are three options on the Comp Type list, Line, Pipe Section and Cable. The default is Line. If you change from the default, the type you specify becomes the default for subsequent postprocessing requests, until you explicitly change it again. This input column only appears in the case where a Model component is assigned to the Custom Postprocessing. |
Comp Name: |
A drop-down list that allows you to select the component for which the snapshot is to be produced. This list contains all components of the specified type in the selected model. There is no default name however when you select a particular component that name becomes the default for subsequent postprocessing requests, until you explicitly change it again. A select all option is also provided on the list if you wish to quickly request postprocessing for all components of the specified type. This input column only appears in the case where a Model component is assigned to the Custom Postprocessing. |
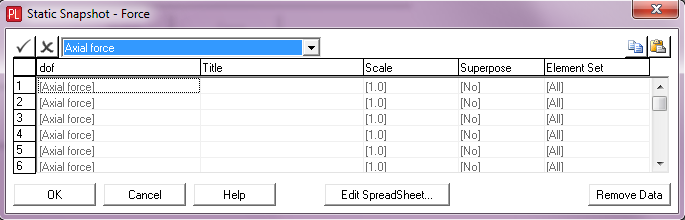
Input |
Description |
dof: |
A drop-down list that allows you to specify the parameter to be plotted. The inputs are largely self-explanatory. |
Time: |
The analysis time at which the snapshot is required. This input is only displayed for dynamic analyses. In the case of a dynamic analysis, when you specify a time value for a snapshot, PipeLay searches the analysis database for the analysis time nearest to the value you input. For a snapshot at the analysis finish time, specify a time that is greater than the finish time you specified in the Analysis component. Units: [seconds] |
Title: |
A descriptive title to be output on the plot. This input is optional. |
Scale: |
A scale factor to apply to the data. This input is optional, and defaults to a value of 1. If you change from the default, the value you specify becomes the default for subsequent postprocessing requests, until you explicitly change it again. |
Superpose: |
This input is used to specify if this plot is to be superposed on the previous one, that is, if this plot and the previous one (and possibly others before that and also others after this) are to appear on the same graph. |
Element Set: |
The element set for which the snapshot is to be produced. By default, Snapshot – Force plots are produced for all elements of the structure (corresponding to the element set “All”). The name of the element set that you specify must correspond either to an element set defined using the Define Element Sets menu (which is brought up by pressing the Element Sets button) or to an element set that is automatically generated by PipeLay. This input column only appears in the case where no Model component is assigned to the Custom Postprocessing. |
Comp Type: |
A drop-down list that allows you to specify the component type for which the snapshot is to be produced. There are three options on the Comp Type list, Line, Pipe Section and Cable. The default is Line. If you change from the default, the type you specify becomes the default for subsequent postprocessing requests, until you explicitly change it again. This input column only appears in the case where a Model component is assigned to the Custom Postprocessing. |
Comp Name: |
A drop-down list that allows you to select the component for which the snapshot is to be produced. This list contains all components of the specified type in the selected model. There is no default name however when you select a particular component that name becomes the default for subsequent postprocessing requests, until you explicitly change it again. A select all option is also provided on the list if you wish to quickly request postprocessing for all components of the specified type. This input column only appears in the case where a Model component is assigned to the Custom Postprocessing. |
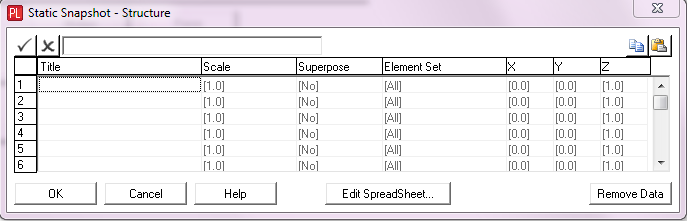
A structure snapshot is a view of a three-dimensional structure projected onto a two-dimensional plane. The co-ordinates of the snapshot viewpoint define this plotting plane, which is normal to a line drawn from the viewpoint to the origin of co-ordinates (this line can be considered a "line of sight"). The X, Y and Z inputs below are used to specify the viewpoint co-ordinates. There is no restriction on the values you specify, except that (0,0,0) is not a valid viewpoint (the line of sight is undefined) – PipeLay will in fact refuse to accept these values. Note that the length of the line of sight is immaterial, and so it is the relative magnitudes of the co-ordinates that are significant, not their absolute magnitudes. The default values of (0,0,1) produce a side elevation of a structure defined in the XY plane, while (1,0,0) produces a plan view.
Input |
Description |
Time: |
The analysis time at which the snapshot is required. This input is only displayed for dynamic analyses. In the case of a dynamic analysis, when you specify a time value for a snapshot, PipeLay searches the analysis database for the analysis time nearest to the value you input. For a snapshot at the analysis finish time, specify a time that is greater than the finish time you specified in the Analysis component. Units: [seconds] |
Title: |
A descriptive title to be output on the plot. This input is optional. |
Scale: |
A scale factor to apply to the data. This input is optional, and defaults to a value of 1. If you change from the default, the value you specify becomes the default for subsequent postprocessing requests, until you explicitly change it again. |
Superpose: |
This input is used to specify if this plot is to be superposed on the previous one, that is, if this plot and the previous one (and possibly others before that and also others after this) are to appear on the same graph. |
Element Set: |
The element set for which the snapshot is to be produced. By default, Snapshot – Structure plots are produced for all elements of the structure (corresponding to the element set “All”). The name of the element set that you specify must correspond either to an element set defined using the Define Element Sets menu (which is brought up by pressing the Element Sets button) or to an element set that is automatically generated by PipeLay. This input column only appears in the case where no Model component is assigned to the Custom Postprocessing. |
Comp Type: |
A drop-down list that allows you to specify the component type for which the snapshot is to be produced. There are three options on the Comp Type list, Line, Pipe Section and Cable. The default is Line. If you change from the default, the type you specify becomes the default for subsequent postprocessing requests, until you explicitly change it again. This input column only appears in the case where a Model component is assigned to the Custom Postprocessing. |
Comp Name: |
A drop-down list that allows you to select the component for which the snapshot is to be produced. This list contains all components of the specified type in the selected model. There is no default name however when you select a particular component that name becomes the default for subsequent postprocessing requests, until you explicitly change it again. A select all option is also provided on the list if you wish to quickly request postprocessing for all components of the specified type. This input column only appears in the case where a Model component is assigned to the Custom Postprocessing. |
X: |
The co-ordinate in the global X direction of the snapshot viewpoint. This input is optional and defaults to 0. If you change it from the default, the value you specify becomes the default for all subsequent structure snapshots, until you change it again. Units: [m] or [ft] |
Y: |
The co-ordinate in the global Y direction of the snapshot viewpoint. This input is optional and defaults to 0. If you change it from the default, the value you specify becomes the default for all subsequent structure snapshots, until you change it again. Units: [m] or [ft] |
Z: |
The co-ordinate in the global Z direction of the snapshot viewpoint. This input is optional and defaults to 1. If you change it from the default, the value you specify becomes the default for all subsequent structure snapshots, until you change it again. Units: [m] or [ft] |

Input |
Description |
DOF: |
The local support degree of freedom for which the snapshot is required. Specify a value of 1 for the local vertical reaction, 2 for the local horizontal reaction or 3 for the local axial reaction. See Note (a). Each requested snapshot displays the reactions, in the selected local degree of freedom, across all supports in the model. |
Title: |
A descriptive title to be output on the plot. This input is optional. |
Scale: |
A scale factor to apply to the data. This input is optional, and defaults to a value of 1. If you change from the default, the value you specify becomes the default for subsequent postprocessing requests, until you explicitly change it again. |
Superpose: |
This input is used to specify if this plot is to be superposed on the previous one, that is, if this plot and the previous one (and possibly others before that and also others after this) are to appear on the same graph. |
Notes:
| (a) | Refer to the ‘Tabular Output - Static Solution Summary (Second Part)’ article, for a detailed description of vertical and horizontal support reactions. Axial reaction represents the reaction parallel to the length of the support which typically is zero in the case of no support friction. |
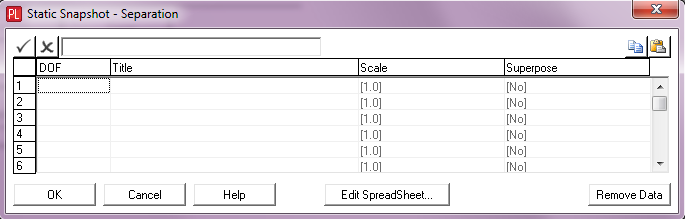
Input |
Description |
DOF: |
The local support degree of freedom for which the snapshot is required. Specify a value of 1 for the local vertical separation, 2 for the local horizontal separation or 3 for the local axial motion. See Note (a). Each requested snapshot displays the separations, in the selected local degree of freedom, across all supports in the model. |
Title: |
A descriptive title to be output on the plot. This input is optional. |
Scale: |
A scale factor to apply to the data. This input is optional, and defaults to a value of 1. If you change from the default, the value you specify becomes the default for subsequent postprocessing requests, until you explicitly change it again. |
Superpose: |
This input is used to specify if this plot is to be superposed on the previous one, that is, if this plot and the previous one (and possibly others before that and also others after this) are to appear on the same graph. |
Notes:
| (a) | Refer to the ‘Tabular Output – Main Output Section’ article, for a detailed description of vertical and horizontal support separations. Axial motion represents the motion of the pipe in the direction parallel to the length of the support. |
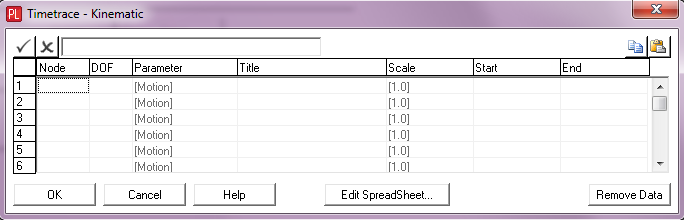
Input |
Description |
Node: |
The node for which the motion timetrace is required. This input column only appears in the case where no Model component is assigned to the Custom Postprocessing. |
Comp Type: |
A drop-down list that allows you to specify the component type for which the timetrace is to be produced. There are three options on the Comp Type list, Line, Pipe Section and Cable. The default is Line. If you change from the default, the type you specify becomes the default for subsequent postprocessing requests, until you explicitly change it again. This input column only appears in the case where a Model component is assigned to the Custom Postprocessing. |
Comp Name: |
A drop-down list that allows you to select the component for which the timetrace is to be produced. This list contains all components of the specified type in the selected model. There is no default name however when you select a particular component that name becomes the default for subsequent postprocessing requests, until you explicitly change it again. A select all option is also provided on the list if you wish to quickly request postprocessing for all components of the specified type. This input column only appears in the case where a Model component is assigned to the Custom Postprocessing. |
Length along Comp: |
The distance to the point of interest from the start of the selected component. This defaults to 0. This input column only appears in the case where a Model component is assigned to the Custom Postprocessing. Units: [m] or [ft] |
DOF: |
The global degree of freedom (DOF) for which the timetrace is required. Specify a value of 1 for the global X direction, 2 for the global Y direction, or 3 for the global Z direction; 4, 5 or 6 for the components of the rotation vector in the global X-, Y- and Z-axes respectively; or 7 for the magnitude of rotation. |
Parameter: |
A drop-down list that allows you to choose the variable to be plotted. The options are Motion (the default), Velocity and Acceleration. |
Title: |
A descriptive title to be output on the plot. This input is optional. |
Scale: |
A scale factor to apply to the data. This input is optional, and defaults to a value of 1. If you change from the default, the value you specify becomes the default for subsequent postprocessing requests, until you explicitly change it again. |
Start: |
The timetrace start time. This input is optional and defaults to the analysis start time. You can use the Start time in a timetrace to exclude initial transients from a plot, if required. The Start and End times together can be used to break a larger timetrace into several smaller ones, to enable the finer detail of the response to be seen. Units: [seconds] |
End: |
The timetrace end time. This input is optional and defaults to the analysis finish time. The Start and End times together can be used to break a larger timetrace into several smaller ones, to enable the finer detail of the response to be seen. Units: [seconds] |
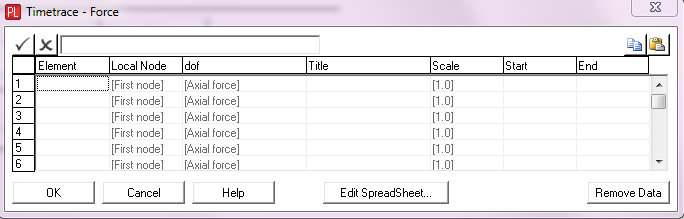
Input |
Description |
Element: |
The element for which the force timetrace is required. This input column only appears in the case where no Model component is assigned to the Custom Postprocessing. |
Local Node: |
A drop-down list that allows you to select one of three locations on the specified element. The default is First node. This input column only appears in the case where no Model component is assigned to the Custom Postprocessing. |
Comp Type: |
A drop-down list that allows you to specify the component type for which the timetrace is to be produced. There are three options on the Comp Type list, Line, Pipe Section and Cable. The default is Line. If you change from the default, the type you specify becomes the default for subsequent postprocessing requests, until you explicitly change it again. This input column only appears in the case where a Model component is assigned to the Custom Postprocessing. |
Comp Name: |
A drop-down list that allows you to select the component for which the timetrace is to be produced. This list contains all components of the specified type in the selected model. There is no default name however when you select a particular component that name becomes the default for subsequent postprocessing requests, until you explicitly change it again. A select all option is also provided on the list if you wish to quickly request postprocessing for all components of the specified type. This input column only appears in the case where a Model component is assigned to the Custom Postprocessing. |
Length along Comp: |
The distance to the point of interest from the start of the selected component. This defaults to 0. This input column only appears in the case where a Model component is assigned to the Custom Postprocessing. Units: [m] or [ft] |
dof: |
A drop-down list that allows you to specify the parameter to be plotted. The inputs are largely self-explanatory. |
Title: |
A descriptive title to be output on the plot. This input is optional. |
Scale: |
A scale factor to apply to the data. This input is optional, and defaults to a value of 1. If you change from the default, the value you specify becomes the default for subsequent postprocessing requests, until you explicitly change it again. |
Start: |
The timetrace start time. This input is optional and defaults to the analysis start time. You can use the Start time in a timetrace to exclude initial transients from a plot, if required. The Start and End times together can be used to break a larger timetrace into several smaller ones, to enable the finer detail of the response to be seen. Units: [seconds] |
End: |
The timetrace end time. This input is optional and defaults to the analysis finish time. The Start and End times together can be used to break a larger timetrace into several smaller ones, to enable the finer detail of the response to be seen. Units: [seconds] |
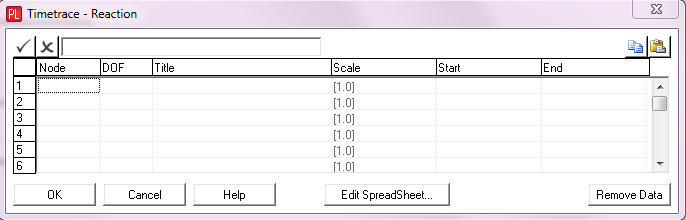
Input |
Description |
Node: |
The restrained node for which the reaction timetrace is required. This input column only appears in the case where no Model component is assigned to the Custom Postprocessing. |
Location: |
A drop-down list that allows you to select the location for which the timetrace is to be produced. This list contains all support components and connection points in the selected model. There is no default location however when you select a particular component or connection that location becomes the default for subsequent postprocessing requests, until you explicitly change it again. This input column only appears in the case where a Model component is assigned to the Custom Postprocessing. |
DOF: |
In the case of a connection point, the global degree of freedom (DOF) for which the timetrace is required. Specify a value of 1 for the global X direction, 2 for the global Y direction, or 3 for the global Z direction, or 4, 5 or 6 for the moments about the global X-, Y- and Z-axes respectively. For a support component, the local support degree of freedom for which the timetrace is required. Specify a value of 1 for the local vertical reaction, 2 for the local horizontal reaction or 3 for the local axial reaction. See Note (a). |
Title: |
A descriptive title to be output on the plot. This input is optional. |
Scale: |
A scale factor to apply to the data. This input is optional, and defaults to a value of 1. If you change from the default, the value you specify becomes the default for subsequent postprocessing requests, until you explicitly change it again. |
Start: |
The timetrace start time. This input is optional and defaults to the analysis start time. You can use the Start time in a timetrace to exclude initial transients from a plot, if required. The Start and End times together can be used to break a larger timetrace into several smaller ones, to enable the finer detail of the response to be seen. Units: [seconds] |
End: |
The timetrace end time. This input is optional and defaults to the analysis finish time. The Start and End times together can be used to break a larger timetrace into several smaller ones, to enable the finer detail of the response to be seen Units: [seconds] |
Notes:
| (a) | Refer to the ‘Tabular Output - Static Solution Summary (Second Part)’ article, for a detailed description of vertical and horizontal support reactions. Axial reaction represents the reaction parallel to the length of the support which typically is zero in the case of no support friction. |
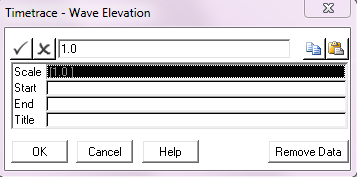
Input |
Description |
Scale: |
A scale factor to apply to the data. This input is optional, and defaults to a value of 1. |
Start: |
The timetrace start time. This input is optional and defaults to the analysis start time. You can use the Start time in a timetrace to exclude initial transients from a plot, if required. The Start and End times together can be used to break a larger timetrace into several smaller ones, to enable the finer detail of the response to be seen. Units: [seconds] |
End: |
The timetrace end time. This input is optional and defaults to the analysis finish time. The Start and End times together can be used to break a larger timetrace into several smaller ones, to enable the finer detail of the response to be seen Units: [seconds] |
Title: |
A descriptive title to be output on the plot. This input is optional. |
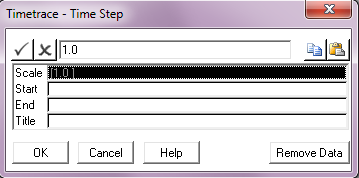
Input |
Description |
Scale: |
A scale factor to apply to the data. This input is optional, and defaults to a value of 1. |
Start: |
The timetrace start time. This input is optional and defaults to the analysis start time. You can use the Start time in a timetrace to exclude initial transients from a plot, if required. The Start and End times together can be used to break a larger timetrace into several smaller ones, to enable the finer detail of the response to be seen. Units: [seconds] |
End: |
The timetrace end time. This input is optional and defaults to the analysis finish time. The Start and End times together can be used to break a larger timetrace into several smaller ones, to enable the finer detail of the response to be seen. Units: [seconds] |
Title: |
A descriptive title to be output on the plot. This input is optional. |

Input |
Description |
Location: |
A drop-down list that allows you to select the location for which the timetrace is to be produced. This list contains all support components in the selected model. There is no default location however when you select a particular support that location becomes the default for subsequent postprocessing requests, until you explicitly change it again. |
DOF: |
The local support degree of freedom for which the timetrace is required. Specify a value of 1 for the local vertical separation, 2 for the local horizontal separation or 3 for the local axial motion. Axial motion timetrace plots for Zero-Gap O-Supports can be requested by specifying DOF 3. See Note (a). |
Parameter: |
A drop-down list that allows you to choose the variable to be plotted. The options are Motion (the default), Velocity and Acceleration. See Note (b). |
Title: |
A descriptive title to be output on the plot. This input is optional. |
Scale: |
A scale factor to apply to the data. This input is optional, and defaults to a value of 1. If you change from the default, the value you specify becomes the default for subsequent postprocessing requests, until you explicitly change it again. |
Start: |
The timetrace start time. This input is optional and defaults to the analysis start time. You can use the Start time in a timetrace to exclude initial transients from a plot, if required. The Start and End times together can be used to break a larger timetrace into several smaller ones, to enable the finer detail of the response to be seen. See Note (c). Units: [seconds] |
End: |
The timetrace end time. This input is optional and defaults to the analysis finish time. The Start and End times together can be used to break a larger timetrace into several smaller ones, to enable the finer detail of the response to be seen. See Note (c). Units: [seconds] |
Notes:
| (a) | Refer to the ‘Tabular Output – Main Output Section’ article, for a detailed description of vertical and horizontal support separations. Axial motion represents the motion of the pipe in the direction parallel to the length of the support. |
| (b) | The Velocity and Acceleration parameters are the successive variations of the Motion parameter with respect to time. These variation parameters are likely to exhibit a transient response at the start and end of the timetrace plot. This is caused by the cubic spline interpolation algorithm that is used in the calculation of the variations, which is sensitive to the number of data points available around a certain time value (less points available around the start/end time). |
Input |
Description |
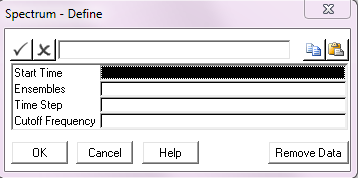
Start Time: |
The start time for the calculation of spectra. PipeLay ignores any values before this time. Use this input to exclude initial transients. Units: [seconds] |
Ensembles: |
The number of ensembles to be used in calculating spectra. The procedure used by PipeLay to calculate spectra is as follows: 1.The output timetrace is divided equally into a number of smaller timetraces or ensembles. 2.A spectrum for each ensemble is then calculated using the Fast Fourier Transform (FFT) algorithm. 3.The actual spectrum to be output is found as an average of the spectra calculated for each ensemble. This standard procedure minimises the statistical error associated with the FFT process. You specify the number of ensembles to be used in this process using the Ensembles input below. This value should always be greater than 1. |
Time Step: |
The time step to be used when calculating spectra from the results of a dynamic analysis with a variable time step. The FFT algorithm requires a record with a fixed time step. When you perform a variable step analysis, obviously such a record is not available, and so PipeLay must synthesise one by interpolating from the variable step record. The Time Step input tells PipeLay what time step to use in the synthesised record. Units: [seconds] |
Cut-off Frequency: |
The spectrum cut-off frequency. PipeLay truncates all spectrum output at this frequency. This input is optional; by default, PipeLay calculates an appropriate value from the simulation length and the number of ensembles you specify. Units: [Hz] |
Input |
Description |
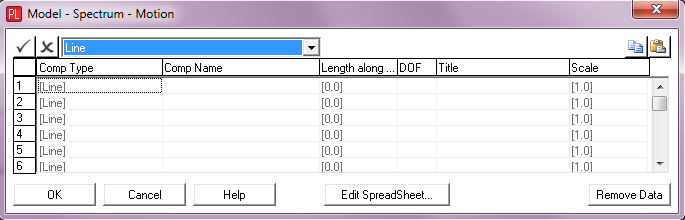
Node: |
The node for which the spectrum of motion is required. This input column only appears in the case where no Model component is assigned to the Custom Postprocessing. |
Comp Type: |
A drop-down list that allows you to specify the component type for which the spectrum is to be produced. There are three options on the Comp Type list, Line, Pipe Section and Cable. The default is Line. If you change from the default, the type you specify becomes the default for subsequent postprocessing requests, until you explicitly change it again. This input column only appears in the case where a Model component is assigned to the Custom Postprocessing. |
Comp Name: |
A drop-down list that allows you to select the component for which the spectrum is to be produced. This list contains all components of the specified type in the selected model. There is no default name however when you select a particular component that name becomes the default for subsequent postprocessing requests, until you explicitly change it again. A select all option is also provided on the list if you wish to quickly request postprocessing for all components of the specified type. This input column only appears in the case where a Model component is assigned to the Custom Postprocessing. |
Length along Comp: |
The distance to the point of interest from the start of the selected component. This defaults to 0. This input column only appears in the case where a Model component is assigned to the Custom Postprocessing. Units: [m] or [ft] |
DOF: |
The global degree of freedom (DOF) for which the spectrum is required. Specify a value of 1 for the global X direction, 2 for the global Y direction, or 3 for the global Z direction; 4, 5 or 6 for the components of the rotation vector in the global X-, Y- and Z-axes respectively; or 7 for the magnitude of rotation. |
Title: |
A descriptive title to be output on the plot. This input is optional. |
Scale: |
A scale factor to apply to the data. This input is optional, and defaults to a value of 1. If you change from the default, the value you specify becomes the default for subsequent postprocessing requests, until you explicitly change it again. |
Input |
Description |
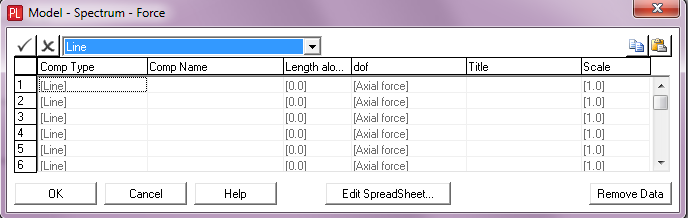
Element: |
The element for which the spectrum of force is required. This input column only appears in the case where no Model component is assigned to the Custom Postprocessing. |
Local Node: |
A drop-down list that allows you to select one of three locations on the specified element. The default is First node. This input column only appears in the case where no Model component is assigned to the Custom Postprocessing. |
Comp Type: |
A drop-down list that allows you to specify the component type for which the spectrum is to be produced. There are three options on the Comp Type list, Line, Pipe Section and Cable. The default is Line. If you change from the default, the type you specify becomes the default for subsequent postprocessing requests, until you explicitly change it again. This input column only appears in the case where a Model component is assigned to the Custom Postprocessing. |
Comp Name: |
A drop-down list that allows you to select the component for which the spectrum is to be produced. This list contains all components of the specified type in the selected model. There is no default name however when you select a particular component that name becomes the default for subsequent postprocessing requests, until you explicitly change it again. A select all option is also provided on the list if you wish to quickly request postprocessing for all components of the specified type. This input column only appears in the case where a Model component is assigned to the Custom Postprocessing. |
Length along Comp: |
The distance to the point of interest from the start of the selected component. This defaults to 0. This input column only appears in the case where a Model component is assigned to the Custom Postprocessing. Units: [m] or [ft] |
dof: |
A drop-down list that allows you to specify the parameter to be plotted. The inputs are largely self-explanatory. |
Title: |
A descriptive title to be output on the plot. This input is optional. |
Scale: |
A scale factor to apply to the data. This input is optional, and defaults to a value of 1. If you change from the default, the value you specify becomes the default for subsequent postprocessing requests, until you explicitly change it again. |
Input |
Description |
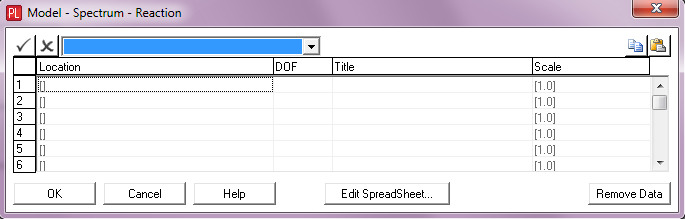
Node: |
The restrained node for which the spectrum of reaction is required. This input column only appears in the case where no Model component is assigned to the Custom Postprocessing. |
Location: |
A drop-down list that allows you to select the location for which the timetrace is to be produced. This list contains all connection points in the selected model. There is no default location however when you select a connection that location becomes the default for subsequent postprocessing requests, until you explicitly change it again. This input column only appears in the case where a Model component is assigned to the Custom Postprocessing. |
DOF: |
The global degree of freedom (DOF) for which the spectrum is required. Specify a value of 1 for the global X direction, 2 for the global Y direction, or 3 for the global Z direction, or 4, 5 or 6 for the moments about the global X-, Y- and Z-axes respectively. |
Title: |
A descriptive title to be output on the plot. This input is optional. |
Scale: |
A scale factor to apply to the data. This input is optional, and defaults to a value of 1. If you change from the default, the value you specify becomes the default for subsequent postprocessing requests, until you explicitly change it again. |

Input |
Description |
Scale: |
A scale factor to apply to the data. This input is optional, and defaults to a value of 1. |
Title: |
A descriptive title to be output on the plot. This input is optional. |

Input |
Description |
Parameter: |
A drop-down list that allows you to choose the statistical parameter required. Envelope in this context means max/min envelopes, Mean is the mean value and Deviation is the standard deviation. The default is Envelope. |
DOF: |
The global degree of freedom (DOF) for which statistics are required. Specify a value of 1 for the global X direction, 2 for the global Y direction, or 3 for the global Z direction; 4, 5 or 6 for the components of the rotation vector in the global X-, Y- and Z-axes respectively; or 7 for the magnitude of rotation. |
Start Time: |
The start time for the calculation of statistics. PipeLay ignores any values before this time. Use this input to exclude initial transients. Units: [seconds] |
Title: |
A descriptive title to be output on the plot. This input is optional. |
Scale: |
A scale factor to apply to the data. This input is optional, and defaults to a value of 1. If you change from the default, the value you specify becomes the default for subsequent postprocessing requests, until you explicitly change it again. |
Superpose: |
This input is used to specify if this plot is to be superposed on the previous one, that is, if this plot and the previous one (and possibly others before that and also others after this) are to appear on the same graph. |
Element Set: |
The element set for which the statistics are to be calculated. By default, statistics are generated for all elements of the structure, which corresponds to the element set “All”. The name of the element set that you specify must correspond either to an element set defined using the Define Element Sets menu (which is brought up by pressing the Element Sets button) or to an element set that is automatically generated by PipeLay. This input column only appears in the case where no Model component is assigned to the Custom Postprocessing. |
Comp Type: |
A drop-down list that allows you to specify the component type for which the statistics are to be calculated. There are three options on the Comp Type list, Line, Pipe Section and Cable. The default is Line. If you change from the default, the type you specify becomes the default for subsequent postprocessing requests, until you explicitly change it again. This input column only appears in the case where a Model component is assigned to the Custom Postprocessing. |
Comp Name: |
A drop-down list that allows you to select the component for which the statistics are to be calculated. This list contains all components of the specified type in the selected model. There is no default name however when you select a particular component that name becomes the default for subsequent postprocessing requests, until you explicitly change it again. A select all option is also provided on the list if you wish to quickly request postprocessing for all components of the specified type. This input column only appears in the case where a Model component is assigned to the Custom Postprocessing. |
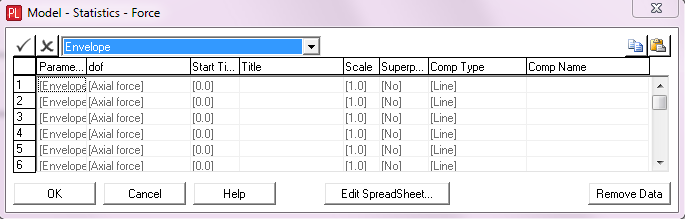
Input |
Description |
Parameter: |
A drop-down list that allows you to choose the statistical parameter required. Envelope in this context means max/min envelopes, Mean is the mean value and Deviation is the standard deviation. The default is Envelope. |
dof: |
A drop-down list that allows you to specify the parameter to be plotted. The inputs are largely self-explanatory. |
Start Time: |
The start time for the calculation of statistics. PipeLay ignores any values before this time. Use this input to exclude initial transients. Units: [seconds] |
Title: |
A descriptive title to be output on the plot. This input is optional. |
Scale: |
A scale factor to apply to the data. This input is optional, and defaults to a value of 1. If you change from the default, the value you specify becomes the default for subsequent postprocessing requests, until you explicitly change it again. |
Superpose: |
This input is used to specify if this plot is to be superposed on the previous one, that is, if this plot and the previous one (and possibly others before that and also others after this) are to appear on the same graph. |
Element Set: |
The element set for which the statistics are to be calculated. By default, statistics are generated for all elements of the structure, which corresponds to the element set “All”. The name of the element set that you specify must correspond either to an element set defined using the Define Element Sets menu (which is brought up by pressing the Element Sets button) or to an element set that is automatically generated by PipeLay. This input column only appears in the case where no Model component is assigned to the Custom Postprocessing. |
Comp Type: |
A drop-down list that allows you to specify the component type for which the statistics are to be calculated. There are three options on the Comp Type list, Line, Pipe Section and Cable. The default is Line. If you change from the default, the type you specify becomes the default for subsequent postprocessing requests, until you explicitly change it again. This input column only appears in the case where a Model component is assigned to the Custom Postprocessing. |
Comp Name: |
A drop-down list that allows you to select the component for which the statistics are to be calculated.. This list contains all components of the specified type in the selected model. There is no default name however when you select a particular component that name becomes the default for subsequent postprocessing requests, until you explicitly change it again. A select all option is also provided on the list if you wish to quickly request postprocessing for all components of the specified type. This input column only appears in the case where a Model component is assigned to the Custom Postprocessing. |
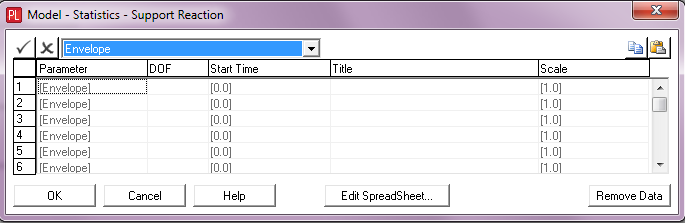
Input |
Description |
Parameter: |
A drop-down list that allows you to choose the statistical parameter required. Envelope in this context means max/min envelopes, Mean is the mean value and Deviation is the standard deviation. The default is Envelope. |
DOF: |
The local support degree of freedom for which the reactions statistical parameter is required. Specify a value of 1 for the local vertical reaction, 2 for the local horizontal reaction or 3 for the local axial reaction. See Note (a). Each requested plot displays the reactions statistical parameter, in the selected local degree of freedom, across all supports in the model. |
Start Time: |
The start time for the calculation of statistics. PipeLay ignores any values before this time. Use this input to exclude initial transients. Units: [seconds] |
Title: |
A descriptive title to be output on the plot. This input is optional. |
Scale: |
A scale factor to apply to the data. This input is optional, and defaults to a value of 1. If you change from the default, the value you specify becomes the default for subsequent postprocessing requests, until you explicitly change it again. |
Notes:
(a)Refer to the ‘Tabular Output - Static Solution Summary (Second Part)’ article, for a detailed description of vertical and horizontal support reactions. Axial reaction represents the reaction parallel to the length of the support which typically is zero in the case of no support friction.
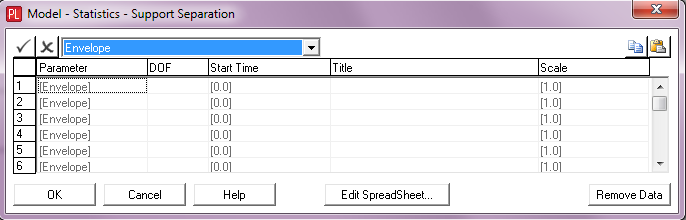
Input |
Description |
Parameter: |
A drop-down list that allows you to choose the statistical parameter required. Envelope in this context means max/min envelopes, Mean is the mean value and Deviation is the standard deviation. The default is Envelope. |
DOF: |
The local support degree of freedom for which the separations statistical parameter is required. Specify a value of 1 for the local vertical separation, 2 for the local horizontal separation or 3 for the local axial motion. See Note (a). Each requested plot displays the separations statistical parameter, in the selected local degree of freedom, across all supports in the model. |
Start Time: |
The start time for the calculation of statistics. PipeLay ignores any values before this time. Use this input to exclude initial transients. Units: [seconds] |
Title: |
A descriptive title to be output on the plot. This input is optional. |
Scale: |
A scale factor to apply to the data. This input is optional, and defaults to a value of 1. If you change from the default, the value you specify becomes the default for subsequent postprocessing requests, until you explicitly change it again. |
Notes:
(a)Refer to the ‘Tabular Output – Main Output Section’ article, for a detailed description of vertical and horizontal support separations. Axial motion represents the motion of the pipe in the direction parallel to the length of the support.
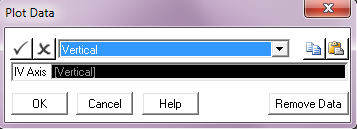
Input |
Description |
IV Axis: |
A drop-down list that allows you to specify whether the independent variable (IV) is plotted on the horizontal or vertical axis in all postprocessing plots. The default is that the independent variable is plotted on the vertical axis. |
Input |
Description |
Set Name: |
A unique label for the element set consisting of up to 256 alphanumeric characters and spaces. |
Elements: |
The elements comprising the element set. The elements comprising the element set can be input in one of following three ways: •A list of element numbers, for example: 1, 5, 7 •A group of consecutive element numbers, input in the format: 12-15 •A combination of the two formats, for example: 1-4, 6, 9, 10-13 |