Plot Files |


|
Plot Files |
|
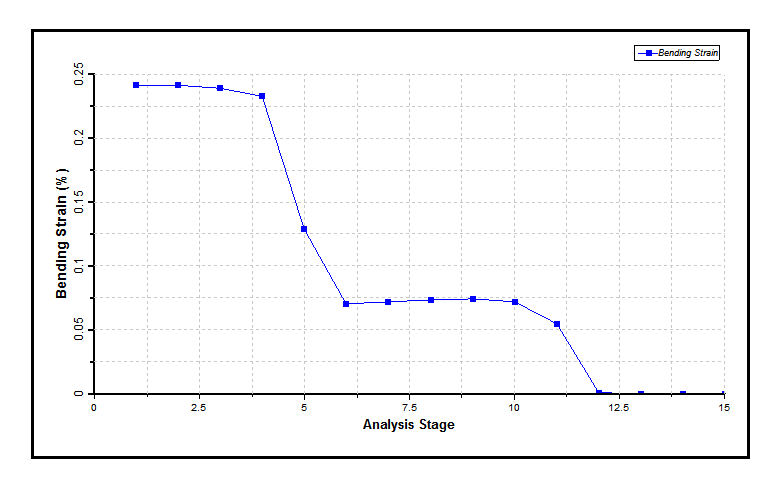
Individual plot files are generated by PipeLay for every graph presented in the analysis report file. Although the analysis report file is in ‘report-ready’ format, the graphs are embedded in the document and may not be edited. The individual plot files though are accessed using the PipeLay Plotting module. This allows you greater flexibility regarding the examination and presentation of results. For example, the plotting module allows you to zoom in on a particular area of interest, and also to superpose plots to facilitate comparisons. Individual plot files are also generated for every graph presented in the summary report file. A sample plot file generated from the summary report file is shown in the figure below.